Key Highlights of Task 2:
- Atypical Mitosis in Tumor Grading: A higher count of atypical mitotic figures is linked to more aggressive cancers.
- Classification Challenges: Atypical mitotic figures are often hard to distinguish from normal mitotic cells as the morphological differences can be very subtle.
- Current AI Limitations: Few AI methods currently exist for atypical mitotic figure classification, leaving a critical gap in automated pathology.
- Connection to Task 1: Building on Task 1’s detection algorithms, Task 2 focuses on refining classification to distinguish normal from atypical mitotic figures.
- Objective: Develop robust, accurate algorithms that can accurately classify atypical vs. normal mitotic figures across a diverse set of tissue domains
Atypical Mitotic Figures: The Next Frontier in AI-Assisted Cancer Assessment
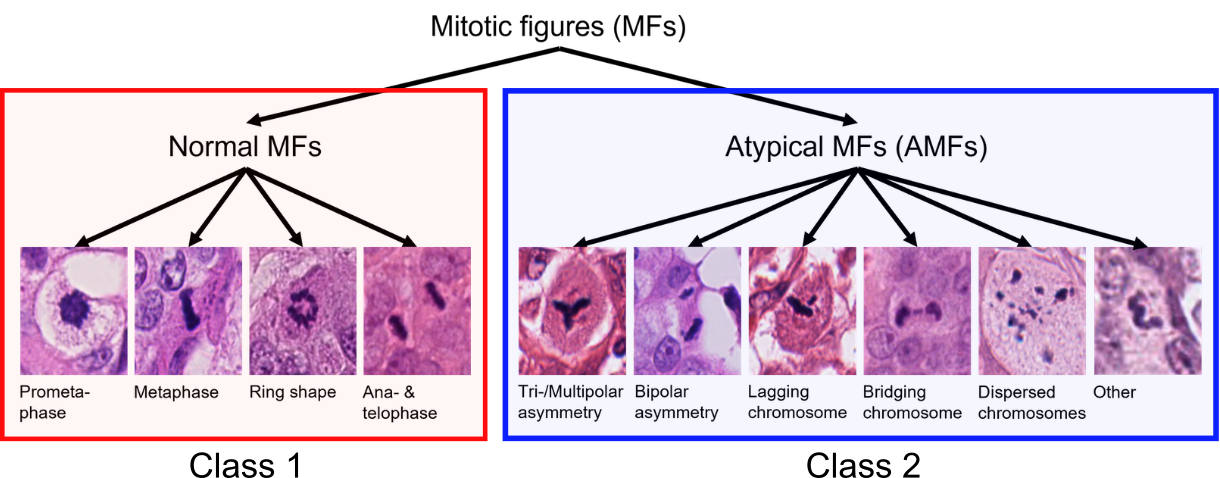
Cancer develops when cells divide uncontrollably. However, not all cancer cell divisions are the same. While many follow structured phases, some go wrong, leading to atypical mitotic figures that lead to the uneven distribution of the genetic material (DNA), which can make the cancer more aggressive.
Recent research suggests that atypical mitotic figures could be an important indicator of how aggressive a cancer is: a higher number of atypical mitotic figures is associated with a higher likelihood for distant spread (metastasis) and death. However, this task is not easy, as even trained pathologists have difficulty to differentiate atypical mitotic figures against normal ones. To improve reproducibility, automated image analysis algorithms have been proposed. As a subsequent step to mitotic figure object detection algorithms (see Task 1), classification algorithms for atypical mitotic figures (AMFs) would provide a new way to assess cancer aggressiveness. However, so far very few studies have explored algorithmic approaches for this task.
Your Task
The MIDOG 2025 challenge is tackling the shortcoming of algorithmic solutions for mitosis subtyping. If you would like to participate in Task 2, you will need to develop accurate and robust algorithms that can differentiate between normal vs. atypical mitotic figures. This means that Task 2 is a binary classification problem. Algorithm development faces four key challenges: (1) severe class imbalance, (2) high morphological variability within each class, (3) subtle differences between normal and atypical figures and (4) a wide range of different tumor, species, staining and scanner domains.
To address these challenges, participants can explore techniques such as domain adaptation, domain-invariant feature extraction, style transfer, test-time augmentation, or ensembling. Creativity is encouraged. Innovative approaches that improve generalization and robustness will be key to success. By tackling these issues, participants will contribute to the development of tools that enhance diagnostic accuracy and reproducibility across laboratories worldwide.
The Training Dataset(s)
Similarly to Task 1, participants are allowed to use all publicly available datasets for training their classification models. In this task, the goal is the classification of cropped-out cell patches sized 128×128 into normal mitotic figures (NMFs) and atypical mitotic figures (AMFs). Subtyping information regarding normal vs. atypical mitotic figures is not common in most of the datasets, so we release a new data source derived from the MIDOG++ dataset, which includes crops of 10,191 normal mitotic figure and 1,748 atypical mitotic figure annotations across 454 labeled images from 9 distinct domains, which are defined by unique combinations of tumor types, species, scanners, and laboratories. We also recommend participants to use the recently published AMi-Br dataset, which consists of mitotic cell crops of human breast cancer tissue (part of the MIDOG2021 dataset).
Please note that AMi-Br and MIDOG++ are partially overlapping, since they both contain the MIDOG21 training images for human breast cancer, i.e., the files corresponding to the original file names 001.tiff to 150.tiff are in both sets.
The Test Datasets(s)
The test set for Task 2 will consist of the ground truth mitotic figure crops of the Task 1 test set. It consists of 120 cases, covering 12 distinct tumor types from both human and veterinary pathology. Each tumor type is represented by 10 cases, ensuring a balanced and comprehensive evaluation. These tumor types include well-known examples such as lung adenocarcinoma, glioblastoma, round cell tumors, epithelial tumors, and mesenchymal tumors. To further enhance the diversity of the dataset, two additional tumor types from a new laboratory have been included, expanding the scope beyond what was available in the MIDOG 2022 challenge. This extension ensures that the test set reflects a broader range of histological contexts, making it one of the most diverse datasets ever used in a mitotic figure detection challenge.
To support participants during the development phase, a preliminary debug dataset will be made available for evaluation on the Grand Challenge platform during a period of approximately 14 days preceding the final submission deadline. This dataset includes four tumor types that are not part of the final test set, allowing participants to verify the functionality of their algorithms without revealing the characteristics of the final test cases. The preliminary evaluation dataset is designed to mimic the overall structure and challenges of the final test set. However, we want to highlight that most likely high performance on the preliminary evaluation set is not a good predictor on high performance on the final test set, due to being from completely different domains.
Evaluation metric
Atypical mitotic figures occur at highly different rates across patients, but overall account for approximately only 20% of mitotic figures. Given the varying prevalence of atypical mitotic figures, we use balanced accuracy (BA) as the primary metric, ensuring fair evaluation regardless of class distribution. Balanced accuracy is calculated as:
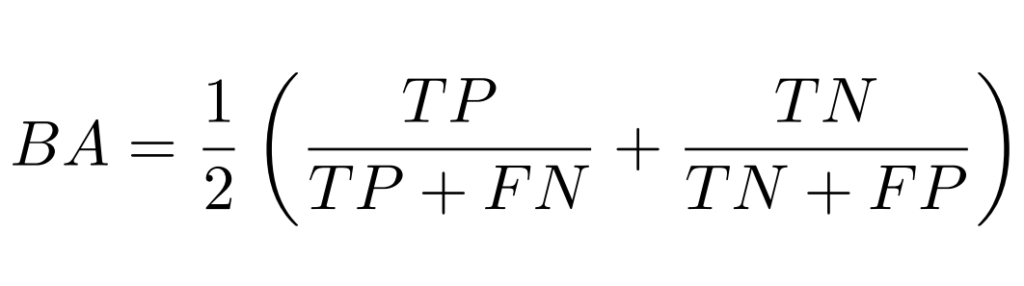
In this case, “positive” samples are normal mitotic figures, whereas “negative” samples refer to AMFs. The BA metric will be calculated over all patches of the test set (i.e. no averaging will be done on a case level).